Blog Post 1: Introduction
Blog Post 1: Introduction
Map of Republican/Democrat vote-share margin by state, 2020 House Elections Editing the code from our lab session, I created a map of the vote share margins by state in the 2020 House of Representatives election. The variable being visualized is the two-party vote share margin, calculated by finding the difference between the percentage of votes for Republican candidates and the percentage of votes for Democratic candidates within a given state. This represents the popular vote breakdown within states, not the winner of each Congressional district. In the map, a margin of 1 and a dark red color indicates 100% of the vote share went to Republicans. A margin of -1 and a dark blue color indicates 100% of the vote share went to Democrats. For context, in the 2020 House of Representatives election, Democrats won 222 seats and 50.8% of the popular vote, as compared to the Republicans victory of 213 seats and 47.7% vote share.
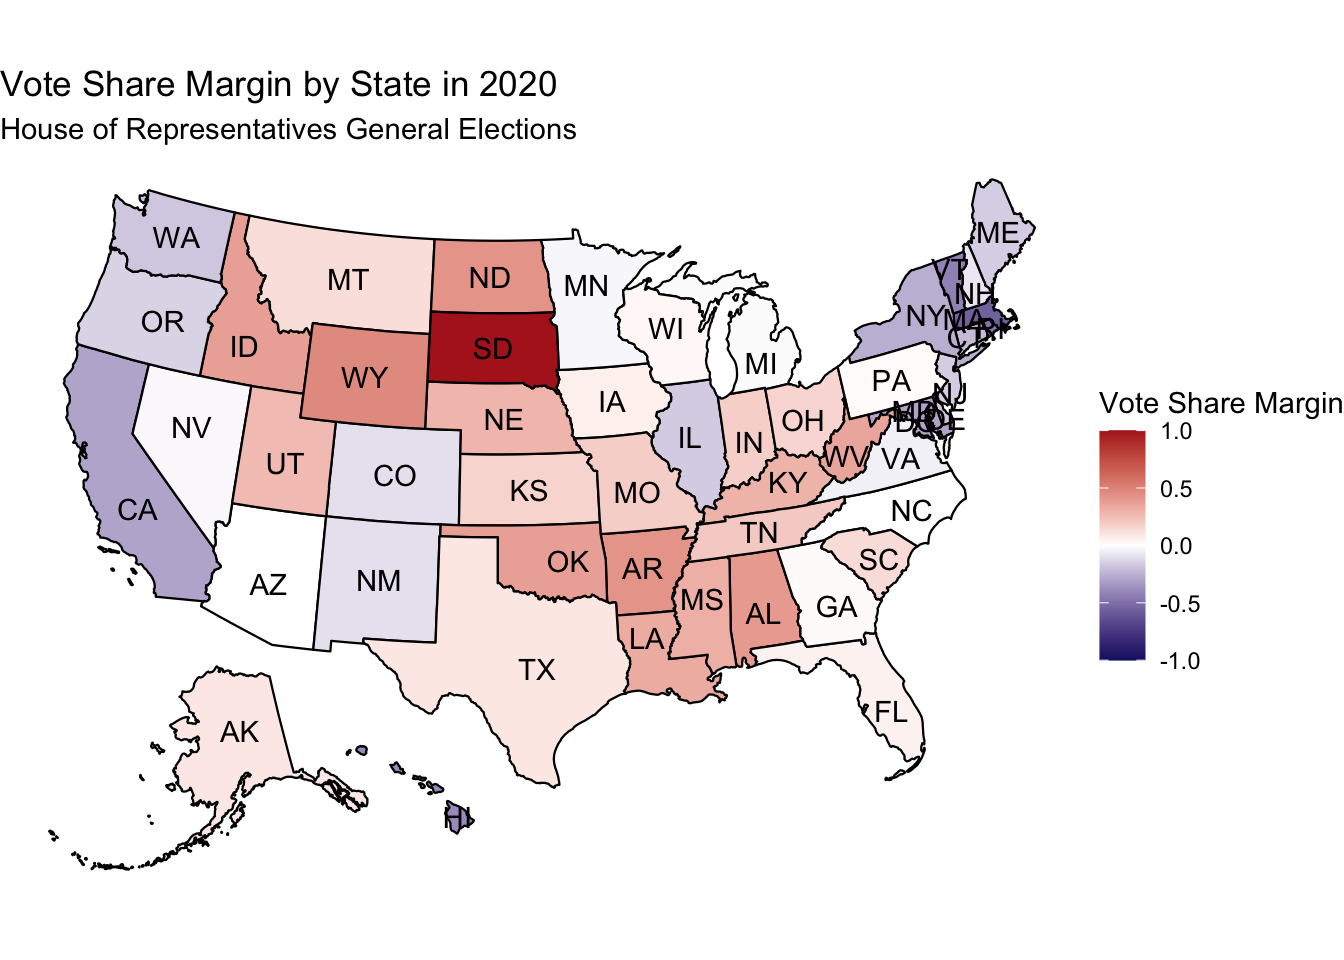 The map shows more muted colors, indicating weaker margins of vote share across the US. This is indicative of the overall relatively 50/50 split in popular vote. Some states clearly lean more Democratic or Republican, such as California, Massachusetts, Wyoming, and Alabama.
Interestingly, South Dakota indicates a vote share margin of 1.0 towards Republicans, meaning that Republicans won 100% of the popular vote. This appears to be an error in the data, simply given the incredibly low potential for that result. However, this is not an error. Ballotpedia (https://ballotpedia.org/United_States_House_of_Representatives_election_in_South_Dakota,_2022) notes that for the sole seat vacancy in the House for South Dakota in 2020, the Republican candidate received 81.0% of the vote, compared to the 19.0% for the Libertarian candidate. There were no Democratic candidates in the general race, with all 3 dropping out before the election.
Map of Republican/Democrat seat share margin by state, 2020 House Elections
Next, I created a map of the seat share margin for the 2020 House of Representatives. I calculated the margin as the percentage of seats Republicans won minus the percentage of seats Democrats won within a given state. I used the same color scale, with dark red indicating 100% of seats went to Republicans and dark blue indicating 100% of seats went to Democrats.
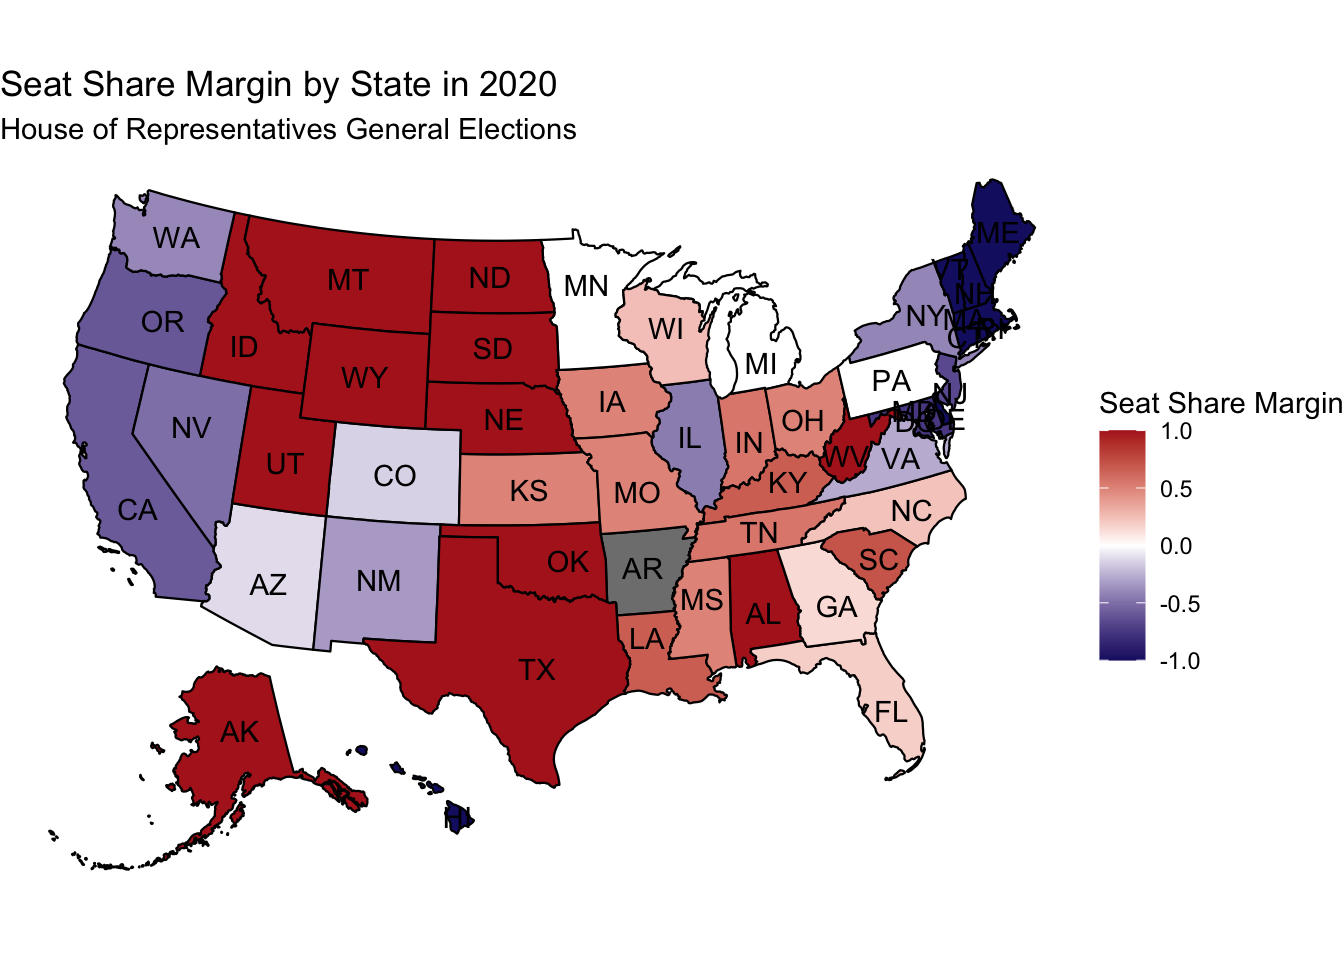 In the seat share margin map, there are also some states that are colored white, indicating that the House seats up for election were split by Republican and Democrat candidates. This is evident in Minnesota, Michigan, and Pennsylvania, all states that are often considered to be swing states. These states were also colored white in the map of the 2020 House popular vote share margin, further cementing this designation as “battlegrounds” - the states have an almost 50/50 split of Democratic and Republican voters.
To note, Arkansas is colored gray because there is no data for Arkansas from the dataset I downloaded. All 4 seats went to Republican candidates, so in the map, Arkansas should be colored in bright red. (https://ballotpedia.org/United_States_House_of_Representatives_elections_in_Arkansas,_2020)
In the seat share map, there are much stronger, extreme margins as compared to the vote share map. This is most noticeable when considering Republican seat share, as multiple states across the south and west of the US only elected Republican candidates. This can be explained by the significant variation in vote share, especially given the number of individuals and amount of data available. This also may be an indication of gerrymandering and how political representation is not always proportional to the people within a state or district.
Conclusion Overall, this data analysis and the maps I’ve made demonstrate the importance of considering the context behind the data as we analyze it. For the vote share margin map, without checking the results of the South Dakota election, I would have assumed that there was a problem with the data. It also emphasizes that just looking at the two-party split does not always give the entire picture of an election. Checking data sources is also key when considering the 2020 House seat share margin map in terms of the problem with the lack of Arkansas data.
Citation House general elections, All States, 2020 summary. (2022). CQ voting and elections collection (web site). http://library.cqpress.com.ezp-prod1.hul.harvard.edu/elections/avg2020-3us1