on
Blog Post 2: Economic Forces
Wright (2012) analyzed the effect of unemployment rate on the Democratic two-party vote share in Presidential and Governor elections. Given the upcoming midterms, I wanted to study how the unemployment rate impacts Congressional races. I used the same measurements as Wright (2012): one as unemployment rate in the county in October of the election year, and the other as change in unemployment rate from January to October of the election year. The data set I used was 1976-2018 and included incumbency, Democratic and Republican vote share, all at the state level. I joined this with another data set of the unemployment rate which was given by state and month, from 1978-2018. I subset the combined data to midterm election years.
My primary goal was to see which measurement of unemployment served as a better model for predicting Democratic vote share. Secondarily, I wanted to see how my results compared to that of Wright (2012), in which they found that higher unemployment actually increases the vote shares of Democratic candidates.
First, I looked at the unemployment rate only from October of the midterm election year and found a positive but weak relationship. The correlation coefficient between the two variables is 0.05. The linear regression model is y = 0.082x + 50.858, indicating that an increase in 1% unemployment results in an increase in 0.08% vote share for the Democrats in the midterm House election. While this does support Wright (2012), my analysis was not statistically significant, and the R^2 was 0.00122, indicating that this can only explain 0.122% of the variability in the prediction.
October data
## [1] 0.05283837##
## ===============================================
## Dependent variable:
## ---------------------------
## D_majorvote_pct
## -----------------------------------------------
## percent 0.082
## (0.062)
##
## Constant 50.858***
## (0.403)
##
## -----------------------------------------------
## Observations 636
## R2 0.003
## Adjusted R2 0.001
## Residual Std. Error 3.599 (df = 634)
## F Statistic 1.775 (df = 1; 634)
## ===============================================
## Note: *p<0.1; **p<0.05; ***p<0.01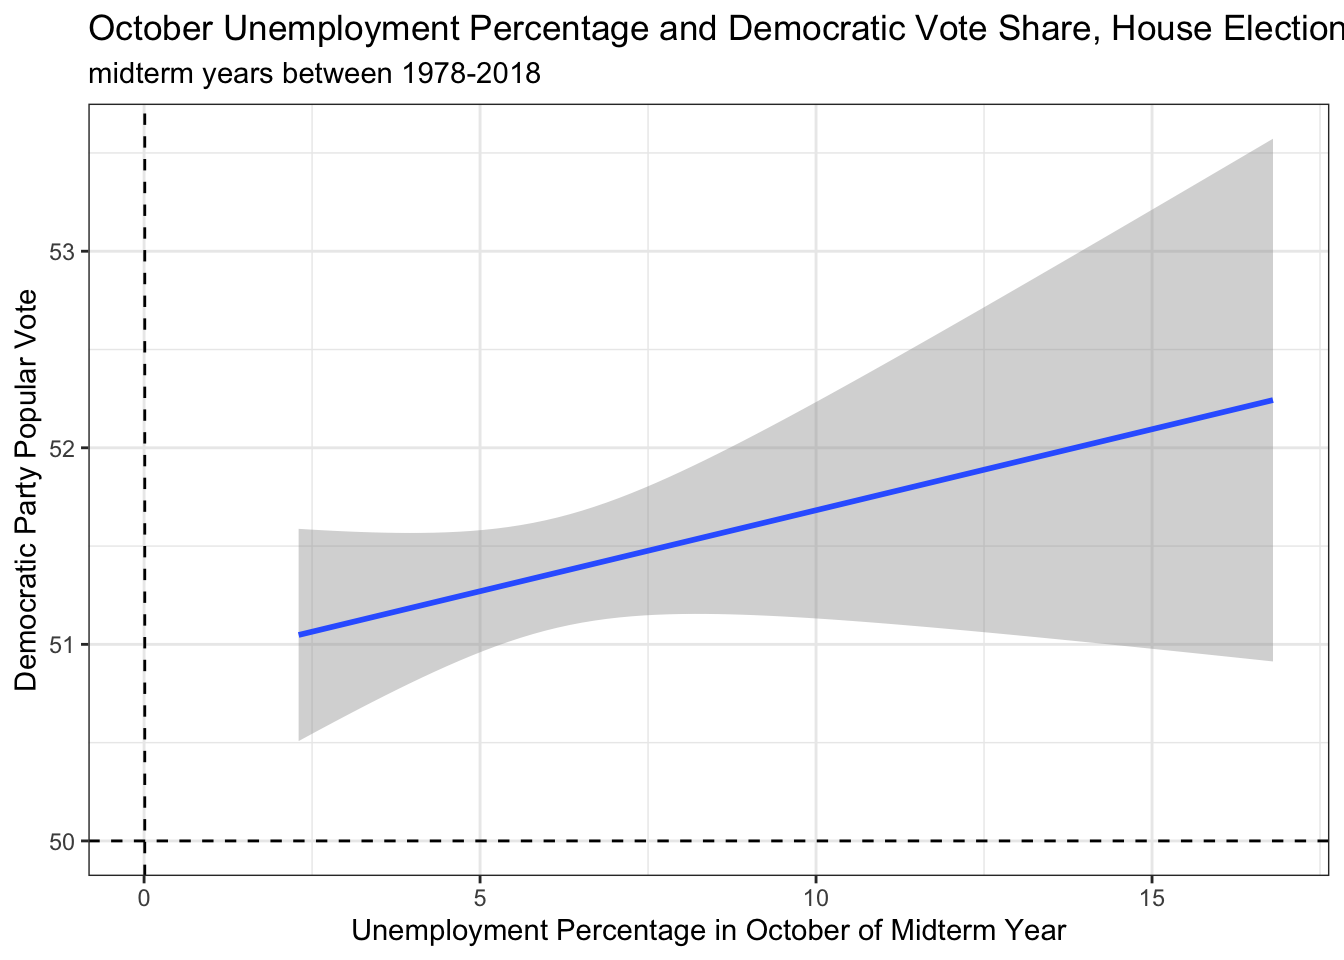 To further test Wright (2012)’s theory in relation to the Congressional midterms, I analyzed the relationship between Democratic vote share and unemployment rate when Republicans were the incumbent party. However, my analysis fails to provide support for Wright (2012)’s claims. During years in which the incumbent party was Republican, there is a weak, negative relationship between unemployment rate and Democratic vote share. The correlation coefficient is -0.5408313 and the linear regression model is y = -1.467x + 58.606, indicating an increase in 1% unemployment is associated with a decrease in Democratic vote share by 1.467%. This is statistically significant and the R^2 is 0.288, indicating this can explain 28.8% of the variability in the prediction model.
Despite this, when the Democrats are the incumbents, they still see a positive relationship between vote share and unemployment rate, indicating their voters do not seem to punish them for rising unemployment. The correlation coefficient is 0.193 and the linear regression model is y = 0.30391x + 49.147, indicating an increase in 1% in unemployment rate is associated with an increase in Democratic vote share by 3.03%. While this is statistically significant, it only accounts for 3.53% of the variation in the model.
Republican Incumbent
## [1] -0.5408313##
## ===============================================
## Dependent variable:
## ---------------------------
## D_majorvote_pct
## -----------------------------------------------
## percent -1.467***
## (0.182)
##
## Constant 58.606***
## (0.852)
##
## -----------------------------------------------
## Observations 159
## R2 0.292
## Adjusted R2 0.288
## Residual Std. Error 2.703 (df = 157)
## F Statistic 64.908*** (df = 1; 157)
## ===============================================
## Note: *p<0.1; **p<0.05; ***p<0.01Democrat Incumbent
## [1] 0.193193##
## ===============================================
## Dependent variable:
## ---------------------------
## D_majorvote_pct
## -----------------------------------------------
## percent 0.304***
## (0.071)
##
## Constant 49.147***
## (0.498)
##
## -----------------------------------------------
## Observations 477
## R2 0.037
## Adjusted R2 0.035
## Residual Std. Error 3.640 (df = 475)
## F Statistic 18.416*** (df = 1; 475)
## ===============================================
## Note: *p<0.1; **p<0.05; ***p<0.01Next, I analyzed Wright (2012)’s second measurement of unemployment, subtracting the unemployment rate in January of the election year from the rate in October of that same year.
January - October data
I found a positive but slightly weak relationship between unemployment rate and Democratic vote share. The correlation coefficient between the two variables is 0.357. The linear regression model is y = 1.402x + 51.289, indicating that an increase in 1% unemployment from January to October of the election year results in an increase in 1.402% vote share for the Democrats in the House election. This difference is statistically significant. The R^2 is 0.127, indicating that this explains 12.7% of the variability in the prediction. Comparing this model to the one that analyzed only data from October, the measured change in unemployment rate holds a stronger relationship with Democratic vote share.
Democratic vote share
## [1] 0.3569144##
## ===============================================
## Dependent variable:
## ---------------------------
## D_majorvote_pct
## -----------------------------------------------
## percent_change 1.402***
## (0.103)
##
## Constant 51.289***
## (0.094)
##
## -----------------------------------------------
## Observations 1,272
## R2 0.127
## Adjusted R2 0.127
## Residual Std. Error 3.364 (df = 1270)
## F Statistic 185.400*** (df = 1; 1270)
## ===============================================
## Note: *p<0.1; **p<0.05; ***p<0.01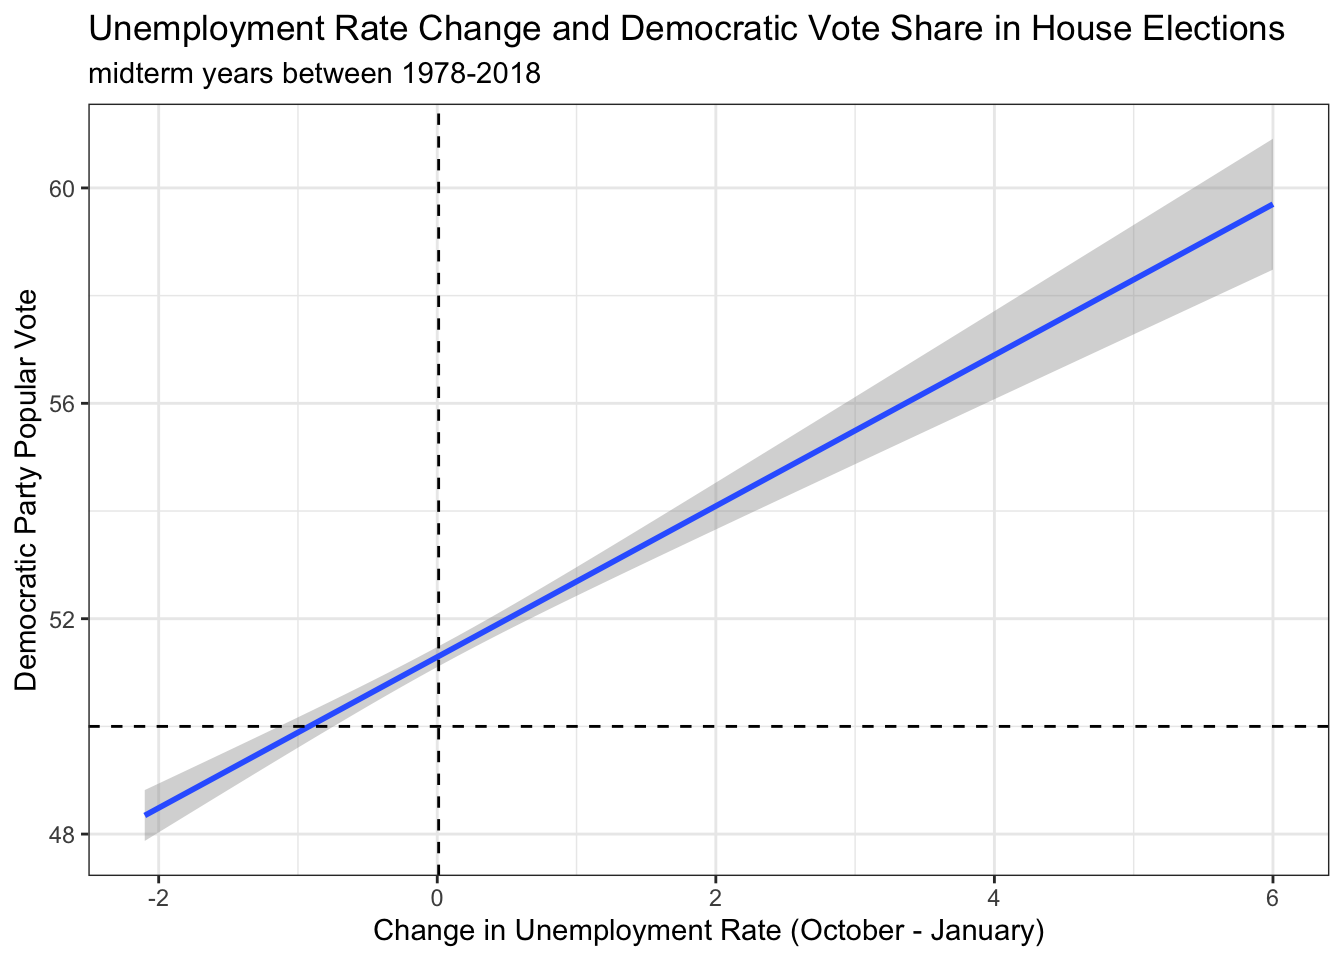
Subsetting to only include cases of Democratic incumbency, I found that the correlation was 0.097, with the model y=0.16x + 50.109. An increase from January to October of 1% in the unemployment rate was associated with an increase in Democratic vote share of 1.6%, though this was not as statistically significant as the last relationship, and only accounted for 0.85% of the variability.
Democrat Incumbent
## [1] 0.09743571##
## ===============================================
## Dependent variable:
## ---------------------------
## D_majorvote_pct
## -----------------------------------------------
## percent 0.160***
## (0.053)
##
## Constant 50.109***
## (0.368)
##
## -----------------------------------------------
## Observations 954
## R2 0.009
## Adjusted R2 0.008
## Residual Std. Error 3.689 (df = 952)
## F Statistic 9.125*** (df = 1; 952)
## ===============================================
## Note: *p<0.1; **p<0.05; ***p<0.01Comparing the two models that both served to include Democratic incumbency, considering that is the case this year, I decided that the one that measured unemployment rate only by the month of October serves as a better predictor, despite also being weak overall. To model the data and predict for the 2022 midterms, I took the average of the prediction across all 50 states based on current rates of unemployment.
In my prediction, the data I am using is from August of this year seeing as it is only mid-September, making the analysis impossible to replicate precisely in order to predict the Democratic vote share of the 2022 midterms. Leaving out 2 months of data and time for the unemployment to potentially fluctuate or change, I understand the potential for misrepresentation and the potential errors in my prediction.
The model predicts that this year, based on August’s unemployment rates, Democrats would win 50.16% of the vote share in the House elections.
Model with October data, Democrat incumbent
## [1] -0.632## [1] 50.16049Meanwhile, just for comparison’s sake, the model for change in unemployment rate predicts that Democrats will win 50.01% of the vote share. There is no strong difference in the two prediction models.
Model with January - October data, Democrat incumbent
## [1] 50.00784From January to August in 2022, unemployment in the US has decreased by an average rate of 0.632%, potentially indicating that Democrats will have the ability to win the popular two-party vote margin, given the above models and voters’ perceptions of politicians’ ability to fix unemployment. With people, on average, “better off” than they were earlier in the year, this may mean they’ll re-elect Democratic candidates. However, it is still early out from the election in terms of unemployment measurements, so that will be something to watch for over the next month.
References: John R Wright. Unemployment and the democratic electoral advantage. American Political Science Review, 106(4):685–702, 2012. ISSN 0003-0554.