on
Blog Post 3: Polling
The most significant difference between the 538 and Economist forecasts are their emphasis - or lack thereof - on polling within their models. While the Economist states that for House elections “the single best indicator is polls,” 538’s House forecast is “less polling-centric” as Nate Silver writes that “districts are polled sporadically and polling can be an adventure because of small sample sizes and the demographic peculiarities of each district.” Instead, for the 2022 midterms, 538 places more weight on the partisan leaning of a state, given the increasing importance of partisanship across the country in how people self-identify, factoring into how they make their decision at the ballot box.
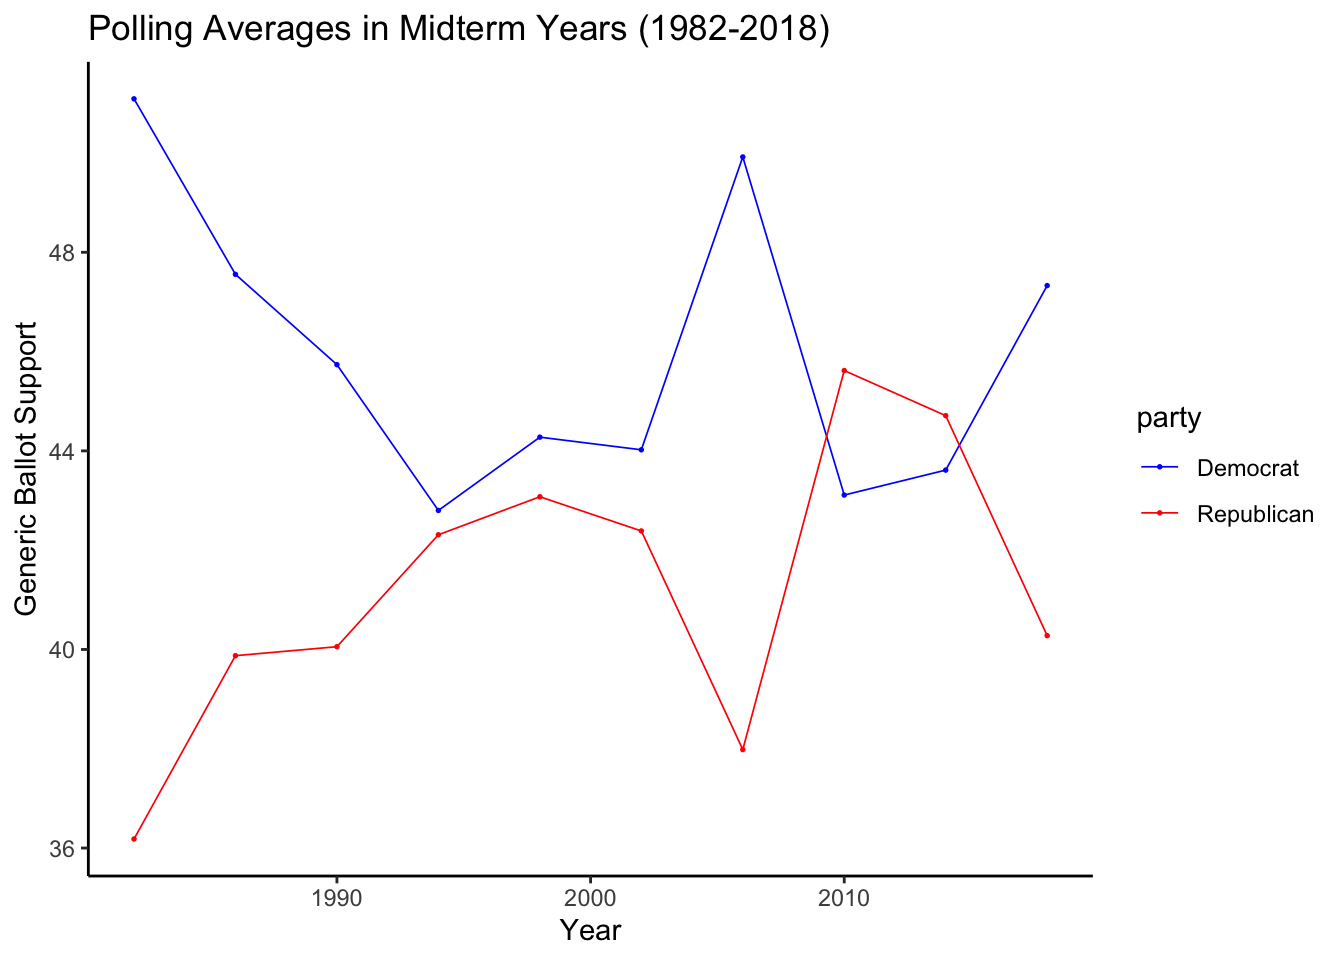
The Economist’s model gives more weight to polls generated closer to the election, given that polls in the first half of an election year are less representative or predictive of final election results while polls conducted close to Election Day more clearly reflect how people will actually vote. The Economist uses the Generic Ballot, a poll that asks what party someone plans to vote for.
Interestingly, neither the Economist or 538 mentions economics as a strong fundamental factor. In fact, 538’s only mention of economic data is their consideration of the amount of fundraising that a candidate receives throughout their race.
As we have learned, voters do not always have a clear understanding of an upcoming election or their views on candidates or important issues until right up until Election Day. With this in mind, while polls like the Generic Ballot can be a relative indicator of the way an election will play out, I am more inclined to agree with 538’s model.
In my model, I focused on polling and economic data during quarters 7 and 8, or the second half of the year of the election. While last week I used quarterly, state-wide unemployment rates, I used national rates this week to make the data frame fit better with the other data frames I used. The popular vote data included the incumbent and challenger party status and the major vote percentage each party received. The polling data included each individual poll, the days until election, the party, and the amount of support the poll found for that particular party. It is important to note that my data set only has 20 observations, given the subsetting of the economic data set to include only election years. This will limit the true predictive value of my model.
Using only the national unemployment rate, the correlation between the Democrat vote share was 0.023 and the correlation between the Republican vote share was -0.023, both very small and weak relationships. This aligns with my findings from last week that unemployment rate is not a strong predictor of vote share. Both R^2 values were 0.0001, further indicating their lack of predictive ability.
##
## ===============================================
##                         Dependent variable:
##                     ---------------------------
##                           D_majorvote_pct
## -----------------------------------------------
## ave_unemploy                   0.023
##                               (0.693)
##
## Constant                     50.933***
##                               (4.549)
##
## -----------------------------------------------
## Observations                    10
## R2                            0.0001
## Adjusted R2                   -0.125
## Residual Std. Error       4.270 (df = 8)
## F Statistic              0.001 (df = 1; 8)
## ===============================================
## Note:               *p<0.1; **p<0.05; ***p<0.01
##
## ===============================================
## Dependent variable:
## ---------------------------
## R_majorvote_pct
## -----------------------------------------------
## ave_unemploy -0.023
## (0.693)
##
## Constant 49.067***
## (4.549)
##
## -----------------------------------------------
## Observations 10
## R2 0.0001
## Adjusted R2 -0.125
## Residual Std. Error 4.270 (df = 8)
## F Statistic 0.001 (df = 1; 8)
## ===============================================
## Note: *p<0.1; **p<0.05; ***p<0.01Looking at the polling data, there was a more significant effect on vote share, which makes sense given the inherent nature of the relationship between who people say they are going to vote for and who they actually vote for. The correlation between Democratic vote share and polling of Democratic average support was 1.24 with an R^2 of 0.81. An increase of 1% in support in the polls for Democrats is associated with an increase of 1.24% in vote share percentage, which is a statistically significant finding. The correlation between Republican vote share and polling of Republican average support was 1.21 with an R^2 of . 0.78. An increase of 1% in support in the polls for Republicans is associated with an increase in 1.21% in vote share percentage. This was also statistically significant. Both R^2 values indicate that about 80% of variation in the predicted models can be explained by these regressions which demonstrates their strong predictive value. These two regression models are interesting as they indicate that the results of an election may be more favorable towards both parties than the polls originally indicated. However, this is interesting given that in midterm election years, turnout is generally lower. Next time, I might consider the difference in polls that are sampled from registered voters compared to likely voters to gain a more clear understanding of actual voter behavior.
##
## ===============================================
##                         Dependent variable:
##                     ---------------------------
##                           D_majorvote_pct
## -----------------------------------------------
## avg_support                  1.242***
##                               (0.212)
##
## Constant                      -6.005
##                               (9.749)
##
## -----------------------------------------------
## Observations                    10
## R2                             0.811
## Adjusted R2                    0.788
## Residual Std. Error       1.855 (df = 8)
## F Statistic            34.405*** (df = 1; 8)
## ===============================================
## Note:               *p<0.1; **p<0.05; ***p<0.01
##
## ===============================================
## Dependent variable:
## ---------------------------
## R_majorvote_pct
## -----------------------------------------------
## avg_support 1.211***
## (0.228)
##
## Constant -1.045
## (9.432)
##
## -----------------------------------------------
## Observations 10
## R2 0.779
## Adjusted R2 0.751
## Residual Std. Error 2.007 (df = 8)
## F Statistic 28.199*** (df = 1; 8)
## ===============================================
## Note: *p<0.1; **p<0.05; ***p<0.01In combining both unemployment and polling in a regression model, it is again clear that polling is the stronger predictive force. For Democratic vote share, the correlation of polling averages is 1.26 and the correlation of unemployment rate is actually negative, -0.23. The R^2 for this model is 0.825, only marginally better than the R^2 of the polling-only model. For Republican vote share, the correlation with polling averages is 1.21, and the unemployment correlation is 0.083. The R^2 is 0.78, also the same as in the polling-only model. The interaction between unemployment and polling is interesting but not statistically significant, given the small correlations and lack of change in R^2 and predictive value.
##
## ===============================================
##                         Dependent variable:
##                     ---------------------------
##                           D_majorvote_pct
## -----------------------------------------------
## avg_support                  1.265***
##                               (0.220)
##
## ave_unemploy                  -0.230
##                               (0.313)
##
## Constant                      -5.608
##                              (10.057)
##
## -----------------------------------------------
## Observations                    10
## R2                             0.825
## Adjusted R2                    0.775
## Residual Std. Error       1.911 (df = 7)
## F Statistic            16.480*** (df = 2; 7)
## ===============================================
## Note:               *p<0.1; **p<0.05; ***p<0.01
##
## ===============================================
## Dependent variable:
## ---------------------------
## R_majorvote_pct
## -----------------------------------------------
## avg_support 1.215***
## (0.243)
##
## ave_unemploy 0.083
## (0.347)
##
## Constant -1.715
## (10.422)
##
## -----------------------------------------------
## Observations 10
## R2 0.781
## Adjusted R2 0.718
## Residual Std. Error 2.137 (df = 7)
## F Statistic 12.467*** (df = 2; 7)
## ===============================================
## Note: *p<0.1; **p<0.05; ***p<0.01Running both in- and out-of-sample tests demonstrates that the polling and combined models are much better predictors of vote share than the national unemployment rate. This was something I also found last week, so going forward unemployment rate will no longer be considered in my predictive model. I have not included the out of sample tests in this blog, but they can be found in my code. From the in-sample fit, there is a more positive relationship within the prediction that uses polling and the one that combines polling with unemployment, compared to the one that only uses unemployment.
As a final prediction, I used the combined model of both unemployment and polling but weighted polling stronger, especially as I was considering polls conducted within the last half of the year before the election. While the intervals are pretty varied, my final prediction for this week has Democrats winning 50.92% of the vote and Republicans winning 49.26%.
##        1
## 50.92543
## 1
## 49.26099References: How does The Economist’s midterms election model work? The Economist. September 9, 2022. https://www.economist.com/the-economist-explains/2022/09/09/how-does-the-economists-midterms-election-model-work
How the House of Representatives forecast works. The Economist. Updated September 25, 2022. https://www.economist.com/interactive/us-midterms-2022/forecast/house/how-this-works
How FiveThirtyEight’s House, Senate And Governor Models Work. Five Thirty Eight. Last edited June 30, 2022. https://fivethirtyeight.com/methodology/how-fivethirtyeights-house-and-senate-models-work/