on
Blog Post 5: The Air Game
This week, we turned from studying the fundamentals of an election to the effects of campaigns themselves, starting with advertising. Are campaign commercials able to persuade voters to vote differently or to turn out in the first place? Research has found that ads have a very short effect, making them not very durable. Their effects decay just after a few days, meaning that even if voters say in the moment after watching an ad that they’ll vote for a particular candidate, a few days later they will have reverted back to their original decision (Hill, Lo, Vavreck, Zaller (2013)). How much does campaign advertising towards the end of an election impact voter behavior?
To answer this, we used a Wesleyan Media Project dataset on campaign advertising spanning from 2012-2018. Variables I was interested in included the airdate, what party had bought the ad, what district it was targeting, and the estimated cost of the ad.
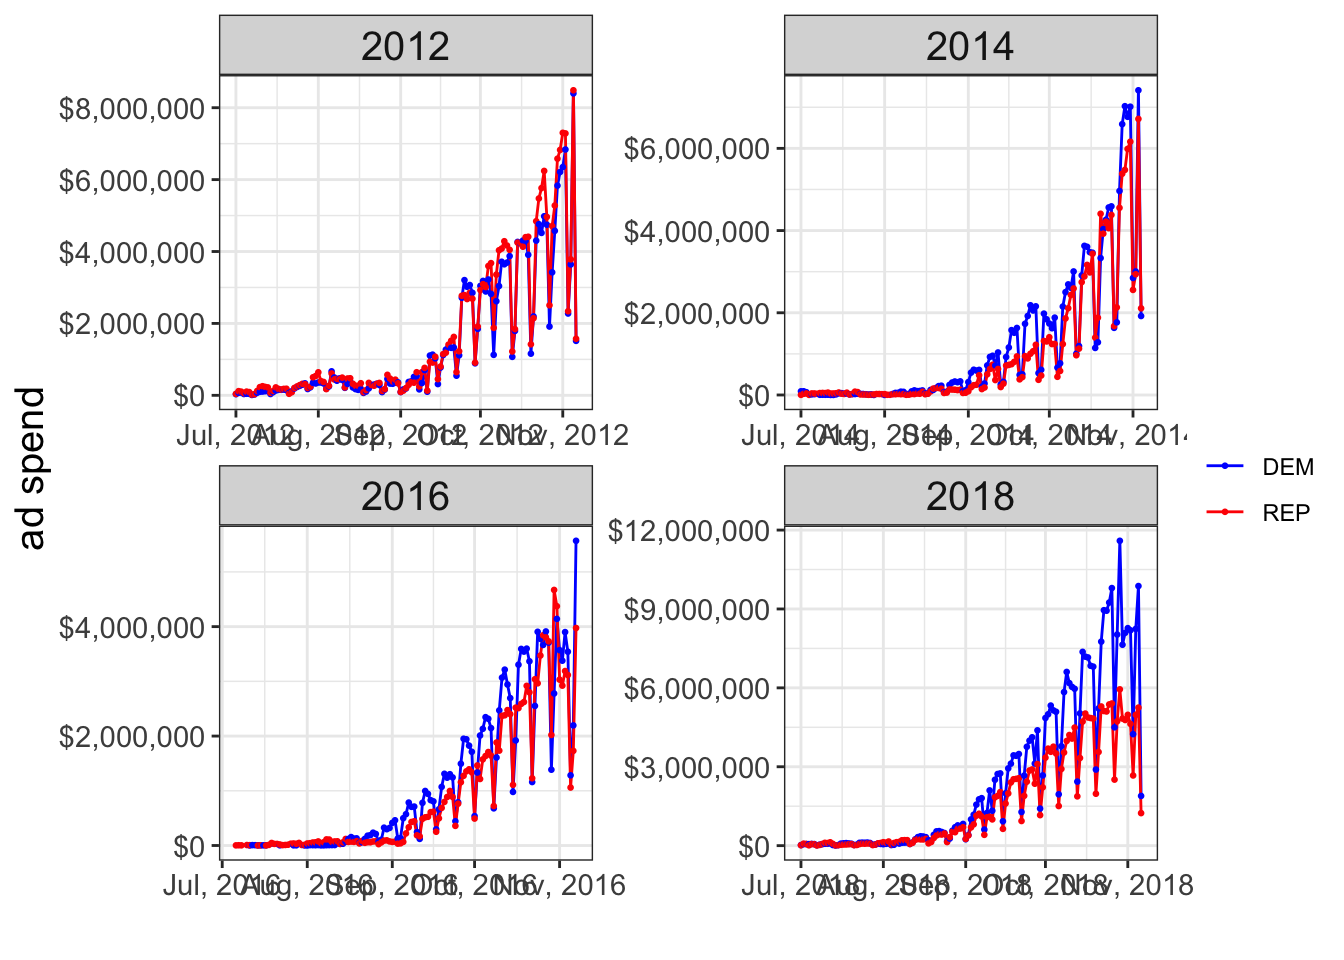
From the ad data, I looked first at the distribution of campaign spending on ads in the second half of an election year, by party. It is clear that spending significantly increases within the last month, even within the last week leading up to Election Day. The total cost is calculated by summing the cost of every ad for a party that was aired on a singular day during the election cycle. While this pattern is noticeable for Democrats and Republicans, the difference in 2018 between the two parties is stark, with Democrats consistently spending significantly more on ads throughout the election.
Next, I looked at the correlation between ad spending and vote share for each party, with the data split to show the winner of the election. This was created based on district level data. It’s evident that in more competitive elections, ones in which the vote share for either party is very close to 50%, more money is spent to target those districts and campaigns.
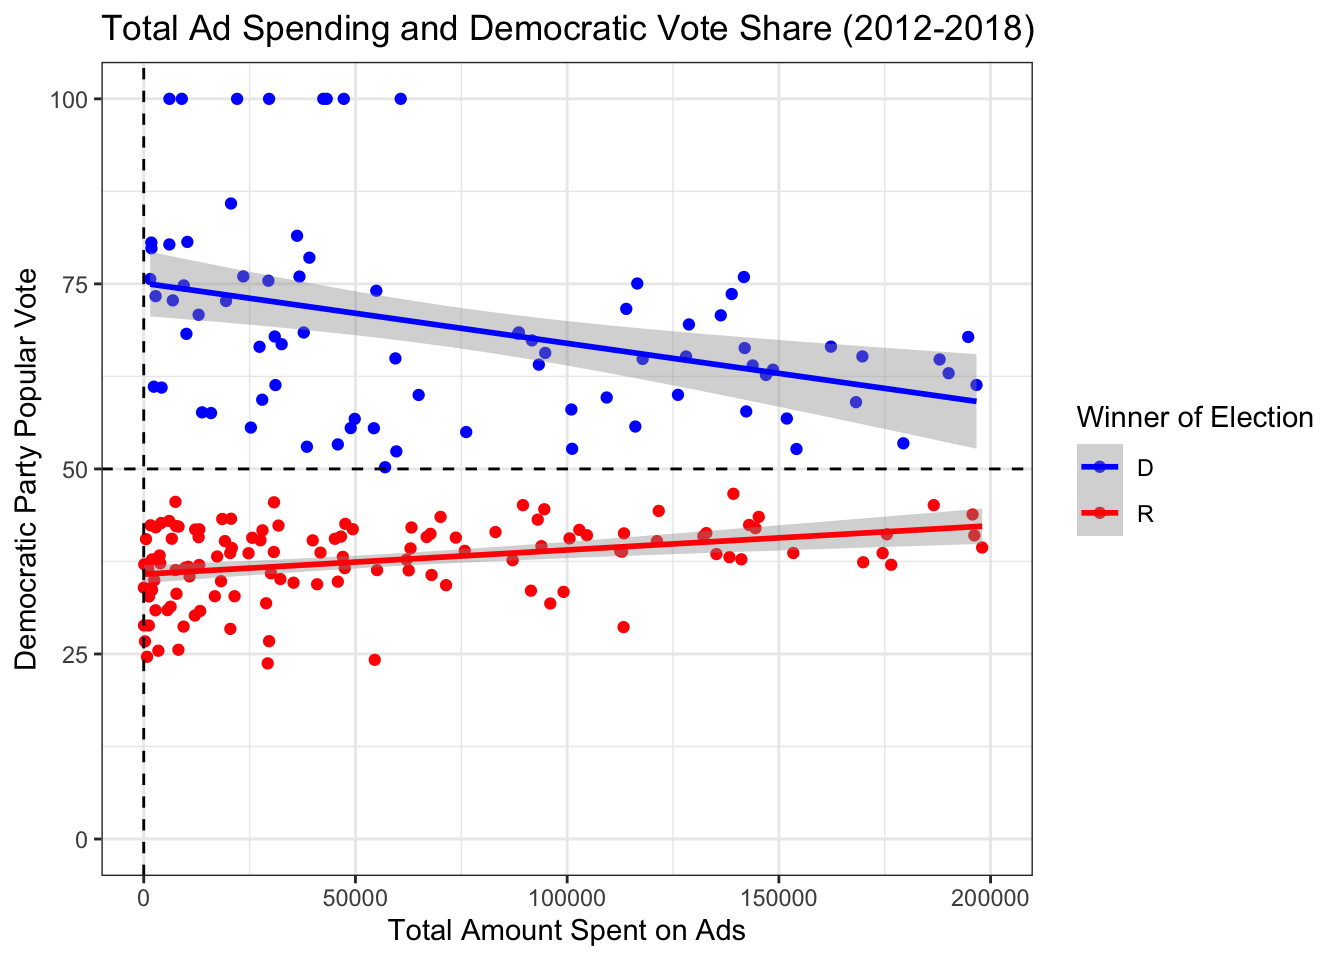
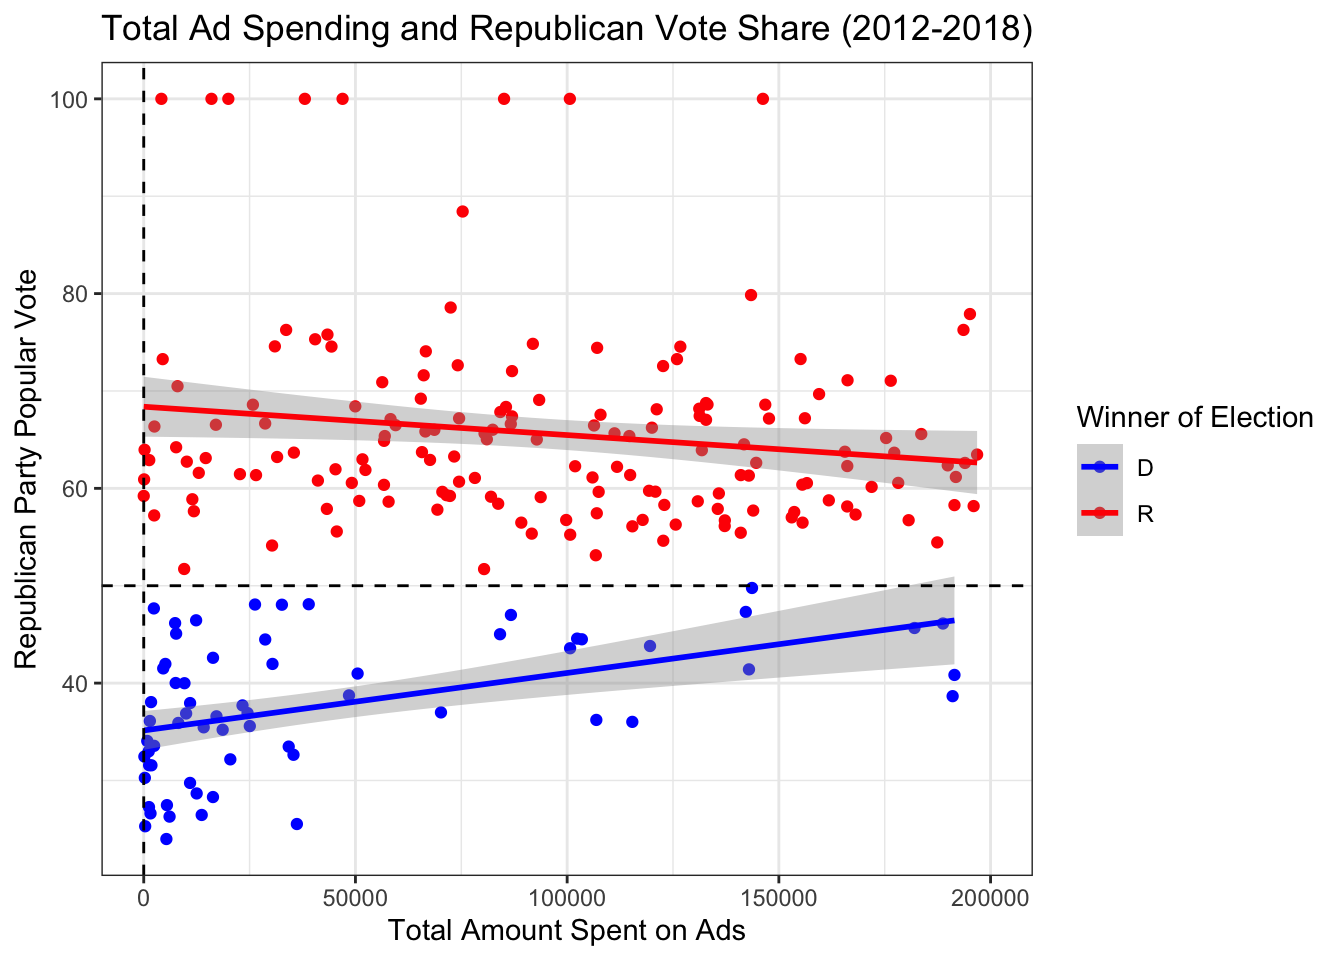
Despite this, the correlation of all these was 0. There was no correlation between ad spending and Democratic vote share for either Democratic or Republican victories, and no correlation between ad spending and Republican vote share for either Democratic or Republican victories. This may be the case due to the data we are working with or to the strong variation in total cost between districts, given that some districts are not covered or don’t spend nearly as much money. These are very interesting results but ultimately just show that ad spending may not be the best measure of how effective ads are as a campaign strategy, as Lynn Vavreck even told us during her visit to our class.
##
## ===============================================
##                         Dependent variable:
##                     ---------------------------
##                        DemVotesMajorPercent
## -----------------------------------------------
## total_cost                  -0.00000***
##                              (0.00000)
##
## Constant                     65.022***
##                               (0.857)
##
## -----------------------------------------------
## Observations                    276
## R2                             0.153
## Adjusted R2                    0.150
## Residual Std. Error      11.390 (df = 274)
## F Statistic           49.651*** (df = 1; 274)
## ===============================================
## Note:               *p<0.1; **p<0.05; ***p<0.01
##
## ===============================================
## Dependent variable:
## ---------------------------
## DemVotesMajorPercent
## -----------------------------------------------
## total_cost 0.00000***
## (0.00000)
##
## Constant 39.365***
## (0.408)
##
## -----------------------------------------------
## Observations 312
## R2 0.193
## Adjusted R2 0.191
## Residual Std. Error 5.847 (df = 310)
## F Statistic 74.284*** (df = 1; 310)
## ===============================================
## Note: *p<0.1; **p<0.05; ***p<0.01##
## ===============================================
## Dependent variable:
## ---------------------------
## RepVotesMajorPercent
## -----------------------------------------------
## total_cost 0.00000***
## (0.00000)
##
## Constant 40.073***
## (0.565)
##
## -----------------------------------------------
## Observations 184
## R2 0.236
## Adjusted R2 0.232
## Residual Std. Error 6.000 (df = 182)
## F Statistic 56.310*** (df = 1; 182)
## ===============================================
## Note: *p<0.1; **p<0.05; ***p<0.01##
## ===============================================
## Dependent variable:
## ---------------------------
## RepVotesMajorPercent
## -----------------------------------------------
## total_cost -0.00000***
## (0.00000)
##
## Constant 63.826***
## (0.537)
##
## -----------------------------------------------
## Observations 425
## R2 0.122
## Adjusted R2 0.120
## Residual Std. Error 9.163 (df = 423)
## F Statistic 58.955*** (df = 1; 423)
## ===============================================
## Note: *p<0.1; **p<0.05; ***p<0.01Building on my prediction model as usual, I joined this advertising data with the data set I’ve been editing over the last few weeks including polling and expert predictions, in order to try to build a better model. However I kept out incumbency because of continuous data and coding problems. My model today also uses 2018 ad spending data as a stand-in for 2022, given the lack of current data available to me. The linear model for Democrats again demonstrates a total lack of correlation between ad spending and vote share, with the experts’ ratings the most predictive (correlation = -2.621). Overall, the adjusted R^2 was 0.771, which does demonstrate a strong predictive model. The same lack of correlation in ad spending was seen with Republican vote share, while experts’ ratings once again were statistically significant and had a slightly stronger correlation than in the Democrats’ vote share (correlation = 3.278). The adjusted R^2 was 0.740.
##
## ===============================================
##                         Dependent variable:
##                     ---------------------------
##                       dem_votes_major_percent
## -----------------------------------------------
## total_cost                  0.00000***
##                              (0.00000)
##
## avg                          -2.621***
##                               (0.054)
##
## poll                         0.131***
##                               (0.012)
##
## Constant                     54.920***
##                               (0.669)
##
## -----------------------------------------------
## Observations                   1,166
## R2                             0.772
## Adjusted R2                    0.771
## Residual Std. Error      2.377 (df = 1162)
## F Statistic         1,311.140*** (df = 3; 1162)
## ===============================================
## Note:               *p<0.1; **p<0.05; ***p<0.01
##
## ===============================================
## Dependent variable:
## ---------------------------
## rep_votes_major_percent
## -----------------------------------------------
## total_cost 0.00000***
## (0.00000)
##
## avg 3.278***
## (0.074)
##
## poll 0.035**
## (0.016)
##
## Constant 34.043***
## (0.617)
##
## -----------------------------------------------
## Observations 1,083
## R2 0.741
## Adjusted R2 0.740
## Residual Std. Error 2.615 (df = 1079)
## F Statistic 1,029.126*** (df = 3; 1079)
## ===============================================
## Note: *p<0.1; **p<0.05; ***p<0.01With all those considerations, my model currently predicts that Democrats would have a vote share of 50.464% and Republicans would have a vote share of 49.908%, basically predicting a tie for the election.
## [1] 50.46499## [1] 49.90811References Hill, SJ, Lo, J., Vavreck, L., & Zaller, J. (2013). How Quickly We Forget: The Duration of Persuasion Effects From Mass Communication. Political Communication, 30(4), 521-547. http://dx.doi.org/10.1080/10584609.2013.828143 Retrieved from https://escholarship.org/uc/item/6g9321sd