on
Final Prediction
Final Vote Share Prediction: 49.45% Democratic vote share (interval: 43.69% to 55.22%) Final Democratic Seat Share Prediction: 207 seats (interval: 171 seats to 239 seats)
Model formula: Democratic Vote Share = Presidential Approval + Candidate Incumbency + Expert Ratings + Unemployment Rate The factors that I considered in my final model to predict Democratic vote share on the district level were: Presidential approval, expert’s ratings on the races, whether the Democratic candidate was the incumbent, and the unemployment rate during October of the election year. I used a multi-linear regression to model the election, weighing all the factors equally, to determine the correlation with Democratic vote share.
I subset the data to predict the seat share distribution for the House. Districts with more than or equal to 50% for Democratic two-party vote were considered Democratic seats, and districts with less than 50% Democratic vote share were considered Republican seats.
Presidential Approval Rating After hearing from the various guests to our class, presidential approval came up repeatedly as a predictor that political scientists used to forecast elections. Midterm elections are well known for being a check on the President’s party, given that the President’s party tends to lose House seats. I chose to use Presidential approval as while it was not a variable we explored in class, I thought it would provide a good understanding of how the public perceived the president and how that may translate to potential punishment at the polls during the midterm elections. The historical data I used was compiled by The American Presidency Project from the Gallup Poll. For the predictive model, I used the most recent Gallup Poll survey. As of survey conducted October 3-20, Joe Biden’s approval rating was 40% I originally wanted to also use a Presidential power variable, but found there was too much collinearity and it messed with my model, so I stuck with Presidential approval.
Candidate Incumbency One interesting area of incumbency research demonstrates that while overall, incumbent parties do not do well in midterm elections, incumbent politicians actually generally do perform well. One reason for this is the power of the bully pulpit that incumbents have, as in office, politicians are able to command public attention, get name recognition, and shape public opinion in a way that challengers to office are not. However, Adam Brown’s research paper Voters Don’t Care Much About Incumbency from 2014 demonstrates that this may not actually be the case. I wanted to test this relationship by coding for individual seat level Democratic incumbency. For this variable, I considered whether or not the incumbent was a Democrat, given that I was predicting Democratic vote share. For historical data, I used the class-provided dataset that included a variable on Democratic incumbency. With the provided 2022 candidate dataset, I coded Democratic incumbency as a binary 1 or 0, with 1 indicating the candidate was an incumbent.
Expert Ratings From a previous blog post for this class, I found that taking the average of experts’ predictions was highly predictive of Democratic vote share - in 2018, there were only 21 instances in which the average of the experts’ ratings were wrong, compared to 412 in which they were correct. I used historical expert predictions from a Ballotpedia dataset that included predictions from Cook, Inside Elections, and Crystal Ball. They were calculated on a scale from 1-7, with 1 indicating Strong Democrat and 7 indicating Strong Republican. For the predictive model, I found expert ratings for every district again through Ballotpedia. The total dataset of U.S. House race ratings were last updated June 21, 2022, which may provide a limitation in my model given the latency.
Unemployment Rate From my earlier work in predicting vote share on economic data, I used the unemployment rate at the state level of October of the election year as an election result predictor. This followed the work of Wright (2012) which analyzed the effect of unemployment rate on the Democratic two-party vote share in Presidential and Governor elections, and found that higher unemployment increases the vote shares of Democratic candidates. I kept unemployment in my model as I found that an increase in 1% unemployment resulted in an increase in 0.08% vote share for Democrats in the midterm House election within a dataset spanning from 1976-2018. For predictive data for this year, statewide unemployment rates were available as of September.
mod_D <- lm(DemVotesMajorPercent ~ pres_approval + demincumb + avg_rating + Unemployed_prct, data = dist2)
stargazer(mod_D, type = 'text', covariate.labels = c("Presidential Approval", "Candidate Incumbency", "Experts' Ratings", "Unemployment Rate"))
##
## =================================================
## Dependent variable:
## ---------------------------
## DemVotesMajorPercent
## -------------------------------------------------
## Presidential Approval 0.078
## (0.190)
##
## Candidate Incumbency -1.321***
## (0.461)
##
## Experts' Ratings -3.049***
## (0.121)
##
## Unemployment Rate -0.300**
## (0.121)
##
## Constant 60.745***
## (7.538)
##
## -------------------------------------------------
## Observations 329
## R2 0.725
## Adjusted R2 0.721
## Residual Std. Error 2.887 (df = 324)
## F Statistic 213.321*** (df = 4; 324)
## =================================================
## Note: *p<0.1; **p<0.05; ***p<0.01Model Coefficients Presidential Approval: 0.078 Stronger approval for the President in power resulted in a slightly weak positive relationship with Democratic vote share, as an increase in 1% for Presidential approval was correlated with an increase in vote share by 0.078%. This was not statistically significant.
Candidate Incumbency (Democrats): -1.321 Democratic candidate incumbency had a significantly significant and negative relationship with vote share - a candidate being the incumbent resulted in a decrease in vote share by 1.3%.
Experts’ Ratings: -3.049 It makes sense that expert ratings are negatively correlated with Democratic vote share, as they are ranked on a scale from 1-7 with 1 indicating a Safe Democratic race. An increase on the scale (meaning a race is less safe for Democrats) is correlated with a 3% decrease in Democratic vote share, which was a statistically significant finding.
Unemployment Rate: -0.300 The economic standing of a state also has a statistically significant relationship with Democratic vote share. As the unemployment rate increases by 1%, Democratic vote share decreases by 0.3%.
The adjusted R^2 for my model was 0.721, indicating that it has relatively strong predictive power. The independent variables I used in my model can explain 72.1% of the variation in Democratic vote share. While this may be improved upon, it is a value that I have been getting relatively consistently with the different iterations of my model (except in some cases with ad spending!).
summary(predDEM)## fit lwr upr
## Min. :39.97 Min. :34.11 Min. :45.82
## 1st Qu.:41.51 1st Qu.:35.77 1st Qu.:47.26
## Median :49.12 Median :43.35 Median :54.89
## Mean :49.45 Mean :43.69 Mean :55.22
## 3rd Qu.:58.29 3rd Qu.:52.52 3rd Qu.:64.07
## Max. :60.07 Max. :54.29 Max. :65.84summary(DemSeats)## fit lwr upr
## Mode :logical Mode :logical Mode :logical
## FALSE:228 FALSE:264 FALSE:196
## TRUE :207 TRUE :171 TRUE :239Model Validation
In Sample: The mean of the absolute value of all residuals was 2.18. Given that the closer a residual is to 0, the better the fit of the model, this indicates that my model is not a bad fit but still could be improved. The mean squared error of the model was 2.86, also indicating that my model has some error.
## [1] 2.180915## [1] 2.864643Out of Sample: For the out of sample evaluation, I removed 2010 data to predict on. The mean of the predicted values minus the true values for the Democratic vote share in 2010 was 0.68. This indicates that my model predicted 2010 vote share relatively well, given that the average error was approximately 0.68 percentage points.
## [1] 0.6841627Limitations As I’ve experienced a few times this semseter, available data proved to be a slight challenge in creating a full dataset of variables at the district level. However, I feel confident that the historical data I predicted on is a strong approximation and holds good predictive power. I also only used data from 2010-2022, which may have limited being able to create a more predictive model.
Another important limitation to note is the wide interval of my prediction at , for both seat share and vote share, which may be due to the more limited dataset or the subset of midterm election years I used.
The lower bound of my prediction interval has Democrats winning just 171 seats and just 43.69% of the two party vote share. The interval for the vote share is definitely very low. The seat share value would indicate a loss of 49 seats in this election. While seat share may be more variable given variability within tossup races, it is still a very low value. For context, in 2014, Republicans won a net gain of thirteen seats in the House. Democrats won 188 seats, which was seen as indicative of the strong Red Wave. For my lower bound prediction to be correct, this would be the result of a remarkable Red Wave.
The upper bound of my prediction interval has Democrats winning 239 seats and 55.22% of the vote share. This is again slightly infeasible, given that Democrats currently hold 220 seats and do not seem positioned to win any more than that.
Conclusions Overall, it has been incredible to be able to predict the election - something I was very unsure I was capable of doing at the beginning of this semester!
Currently, Democrats hold 220 seats in the House. With my model predicting Democrats winning 207 seats in this midterms, this would be a 13 seat loss. This is not implausible, simply given how past midterm elections have served various levels of seat losses for the incumbent President’s party.
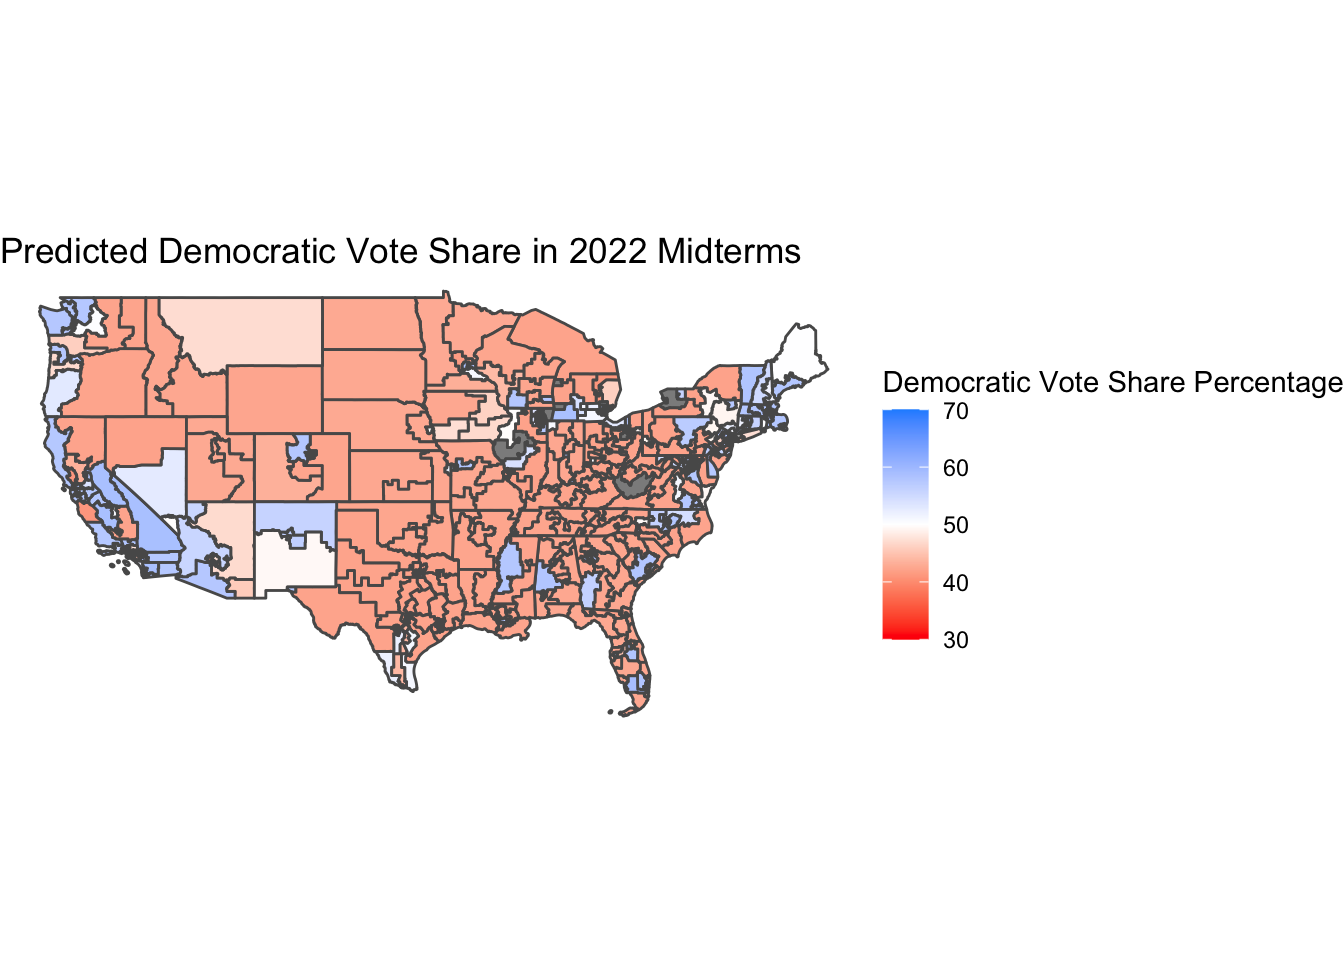
Below, find my graph of predicted Democratic vote share by Congressional district and the. Note that the scale is from 30%-70%, as I wanted to make the differences in vote share more easily perceivable.
Election results will start coming in in just over 24 hours - let’s see how my model holds up!
References Brown, A. (2014). Voters Don’t Care Much About Incumbency. Journal of Experimental Political Science, 1(2), 132-143. doi:10.1017/xps.2014.6
Wright, J. R. (2012). Unemployment and the Democratic Electoral Advantage. The American Political Science Review, 106(4), 685–702. http://www.jstor.org/stable/23357704
The American Presidency Project, University of California, Santa Barbara. Presidential Job Approval dataset. https://www.presidency.ucsb.edu/statistics/data/presidential-job-approval