on
Post Election Reflection
Introduction
It’s been two weeks since the 2022 midterms and it’s time to evaluate how well my model performed! This was a historical election on many fronts, definitely increasing the predicting challenge. The 2022 midterms did not see the subsequent “red wave” that many politicians and journalists claimed would happen as the Democratic Party kept control of the Senate and lost fewer House seats than expected.
Recap of Model
I predicted that Democrats will win 207 seats and Republicans will win 228 seats, which would result in a Republican victory in the House. I predict that Democrats will win 49.45% of the two-party vote share, a tight near-tie across the country.
Final Vote Share Prediction: 49.45% Democratic vote share (interval: 43.69% to 55.22%) Final Democratic Seat Share Prediction: 207 seats (interval: 171 seats to 239 seats)
The factors that I considered in my final model to predict Democratic vote share on the district level were: Presidential approval, expert’s ratings on the races, whether the Democratic candidate was the incumbent, and the unemployment rate during October of the election year. I used a multilinear regression to model the election, weighing all the factors equally.
I subset the data to predict the seat share distribution for the House. Districts with more than or equal to 50% for Democratic two-party vote were considered Democratic seats, and districts with less than 50% Democratic vote share were considered Republican seats.
Model Accuracy
While all the votes are still being counted, as of November 22, 2022, the House popular vote share at the two party margin is 49.4% for Democrats. My error for the vote share using this measure was 0.05% in favor of the Democrats. Overall, Cook Political Report has the vote share margin at 47.6% for Democrats and 50.9% for Republicans, but it is not a strict two-party vote share margin.
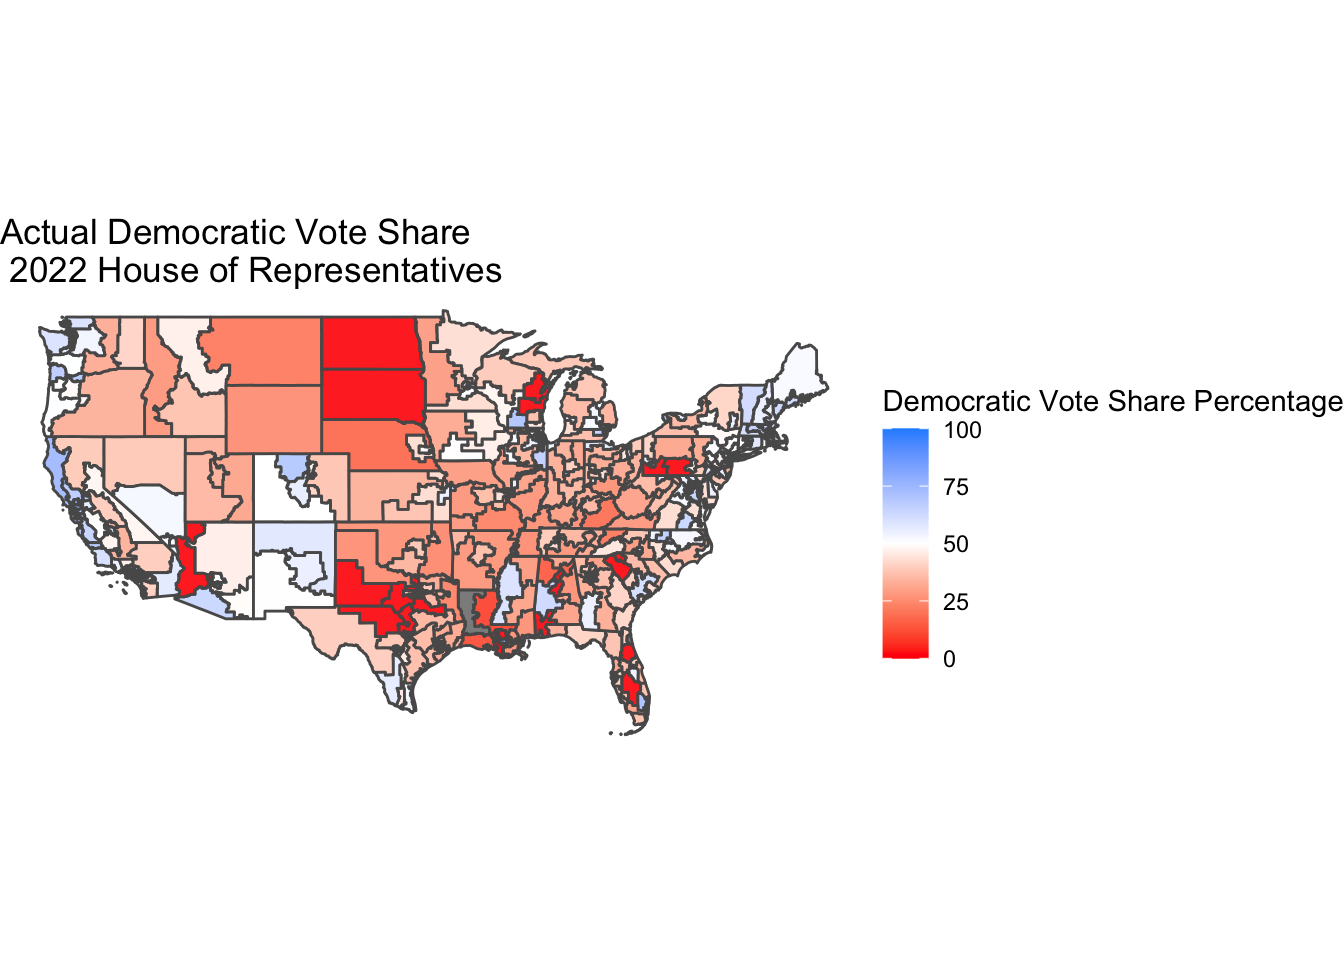
The Democrats hold 212 House of Representatives seats to the Republicans’ 219. Out of the 4 races yet to be called — CA-3, CA-13, CO-3, and AK-1 — Democrats will likely win AK-1 and Republicans will win CO-3. The two California seats are currently more contested but are leaning Republican. The map shows the two-party vote share at the district level for election results as of November 22, 2022.
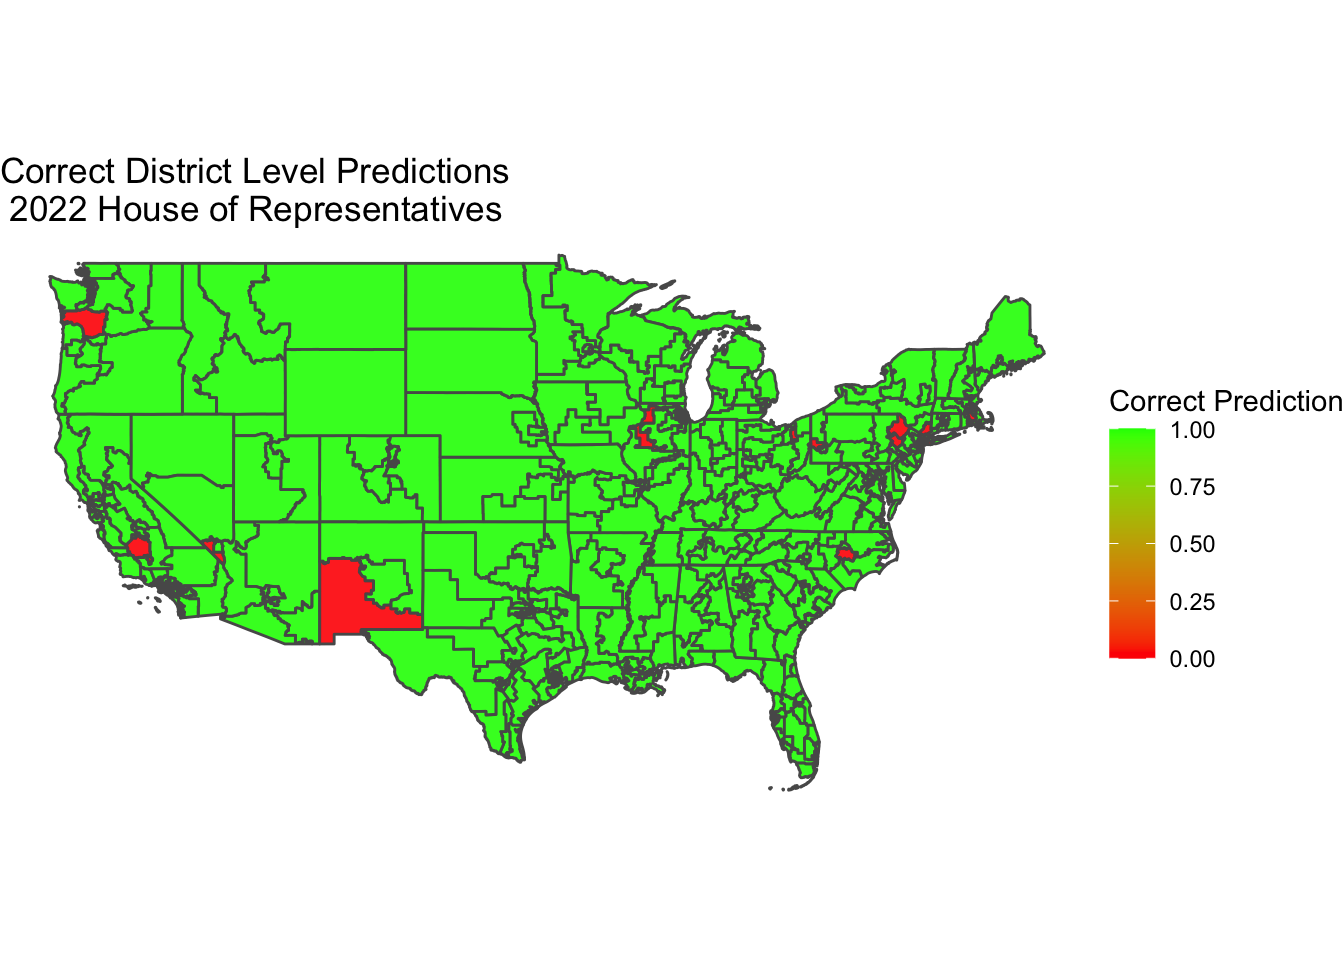
Overall in my prediction, I was off by 5 House seats. Out of all districts, I correctly predicted 422 seats, whether that meant a Democratic or Republican victory. I incorrectly predicted 12 seats. Out of those 12 incorrect seats, I predicted 9 would be Republican victories when the Democratic candidate actually won. See a representation of my seat prediction accuracy at the district level, with green indicating I was correct and red indicating I was incorrect.
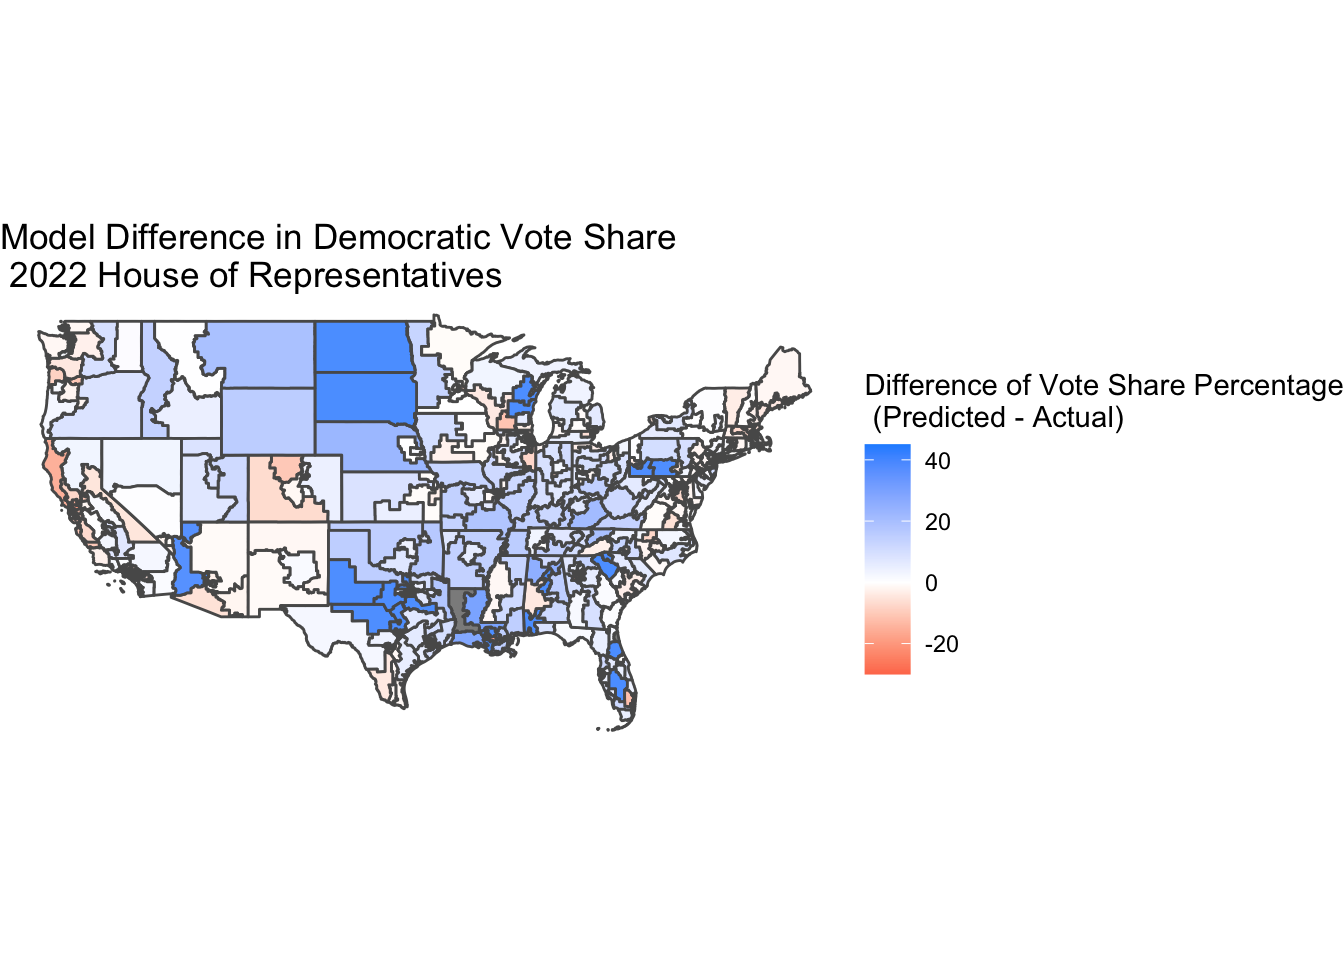
Despite the majority of my incorrect seat predictions actually being won by Democrats instead of Republicans, my model overall had a Democratic bias. In the map of my model’s vote share error for each district, it is clear that I predicted stronger Democratic vote share margins compared to the actual results. I believe this is in part because of the data I trained my model on, especially given that the 2018 midterms saw a large “blue wave.” For the 12 seats I incorrectly predicted, the average error in Democratic vote share percentage was -1.278, indicating that on average, I was off by a margin of 1.278 percentage points.
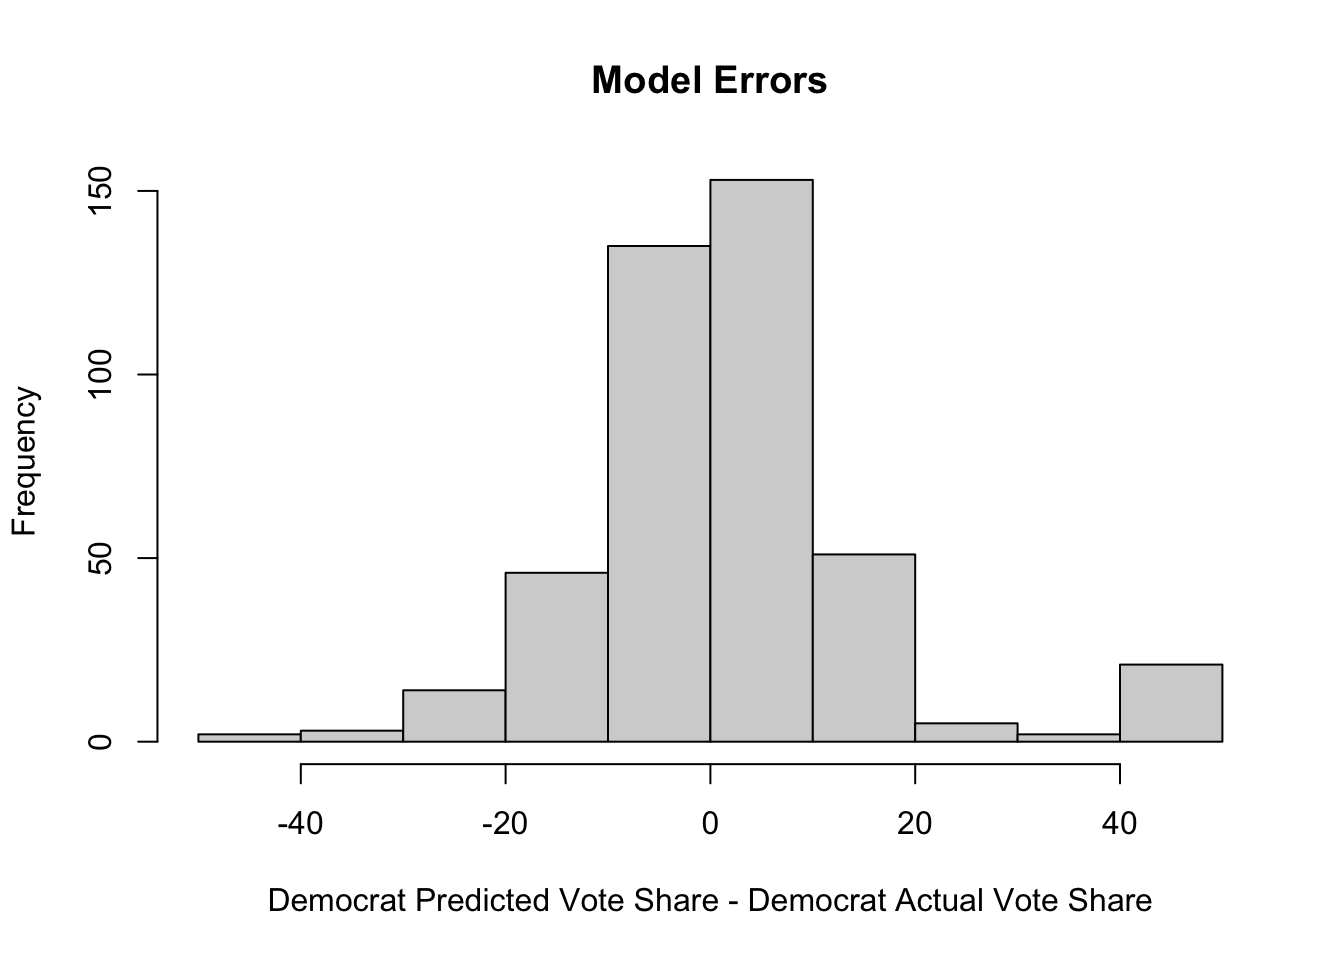
Next, I want to analyze the errors made in the actual vote share predictions at the district level. In the histogram of the errors in my predictions, there is significant range, with errors of both +40 percentage points and -40 percentage points for Democratic vote share. This is the case because in my model, I did not account for races in which there were no Democratic candidates, which is why for races in districts such as Alabama 1, there is significant error. There were 23 districts with an error greater than -30 percentage points, of which 21 had no Democratic candidate. On average in those 23 districts, I predicted the Democratic vote share would be 41.45%, despite there being no candidate.
On the other hand, there were 5 districts in which the error was greater than +30 percentage points, all of which had Democratic vote shares greater than 90%.
If I were to redo my model, I would include a variable for both elections with only Republican or Independent candidates, as well as any uncontested elections in order to account for the final Democratic vote share, whether it is strongly in the direction of the Democratic candidate or not.
The root mean squared error for all of my 435 district predictions was 1.72, indicating on average, my error was 1.72 percentage points in favor of Democrats.
I calculated the Brier score for the districts to assess my prediction’s accuracy. I coded Democratic victories (both my predicted ones and the actual results) as 1 and Republican victories as 0 and took the sum of the squared difference, then took the mean for every district. From that, my Brier score was 0.0298, which indicates that my model was a pretty strong and accurate predictor of the election. I do think that is in part due to the fact that I did not predict the exact probability that a Democrat would win, but just if they would win in the first place. However, this is still a strong indicator I was able to create a good model.
Hypotheses About Model Accuracy and Changes for Replication
Looking at the specifics of my model, I think that the errors I saw could be partially explained by errors also seen in expert models, especially as experts’ ratings were a variable I included. FiveThirtyEight predicted that Democrats would win 205 seats and Republicans would win 230 House seats. The Economist predicted that on average, Democrats were set to win 210 seats. Given this year’s elections were in many ways a deviation from the norm of midterm elections, I think that the errors here are unavoidable when making predictions build on historical data. However, in a new and improved model, I could add in weights for uncontested or solidly Dem/Rep rated races versus those that fall into the likely, lean, or toss-up categories in the ratings. I could make the contested races less reliant on the experts’ prediction as those races are more variable.
While I used unemployment rate during October of the election year, I think I could have instead used inflation rate or RDI, given that those economic measures were more top of mind for voters, as exit polls across the country demonstrated (https://www.cnn.com/election/2022/exit-polls/national-results/house/0). To test this, I could make another iteration of my model that just replaced unemployment rate with inflation rate or gas prices but kept the rest of the predictors the same. Then I could compare the results of the two models to see which was a better fit for the House elections.
Presidential approval rating was less of an accurate predictor during the 2022 midterms than in previous years, with Joe Biden’s approval at a low of 40%. Yet this did not result in the historical precedent of losing a significant number of seats in the House. If I was to redo my model, I do not think I would include Presidential approval rating as it did not seem to be a large enough factor of voters’ decision making.
The factor I would not change would be candidate incumbency as I do still believe this is one of the best predictors of election results. We have discussed in class that while overall, incumbent parties do not do well in midterm elections, incumbent politicians actually generally do perform well. In this election, the incumbent Democrat party performed better than expected, and incumbent politicians also did so (https://www.csg.org/2022/11/16/incumbency-performance-in-state-elections/)
In terms of factors I did not consider but believe turned out to be strong predictors of the election, I would include youth turnout in a new iteration of my model. Youth turnout was heavily impacted the results of the election but I did not account for in my model, given little historical precedence. It would have been difficult to build a turnout model to predict on, but perhaps I could have used weights to better decide how the vote share would be split among the age groups and incorporated demographic data. While my prediction was not built on 2020 data because it was not an election year, I could have used the demographic vote share splits (ie percentage of those aged 18-24 who voted Democratic vs Republican) and weighted that against my midterm election year data. In 2022, the vote margins for Democrats in the 18-24 age group was significant at +28, up from +24 in 2020. (https://www.brookings.edu/research/midterm-exit-polls-show-that-young-voters-drove-democratic-resistance-to-the-red-wave/)
Conclusion
Overall, I am proud of how my model performed! While votes are still being counted and all results will not be finalized for a while, predicting within 0.05% of the popular vote and within 7 House seats is impressive to me. Given my uncertainty and lack of confidence especially at the beginning of the semester about whether or not I would be capable of creating a predictive model, I’ve learned so much and have definitely improved my R skills. I’m not sure if predicting elections full time is in my future but this has been a significantly meaningful project for me.